The data points' colors in the Dashboard Charts derive automatically from the Dashboard "Chart colors" setting. You cannot control the colors for a specific chart, but you can change the color scheme for all Chart Widgets on a Dashboard.
1. Go to Dashboards and click on Settings on a Dashboard card.
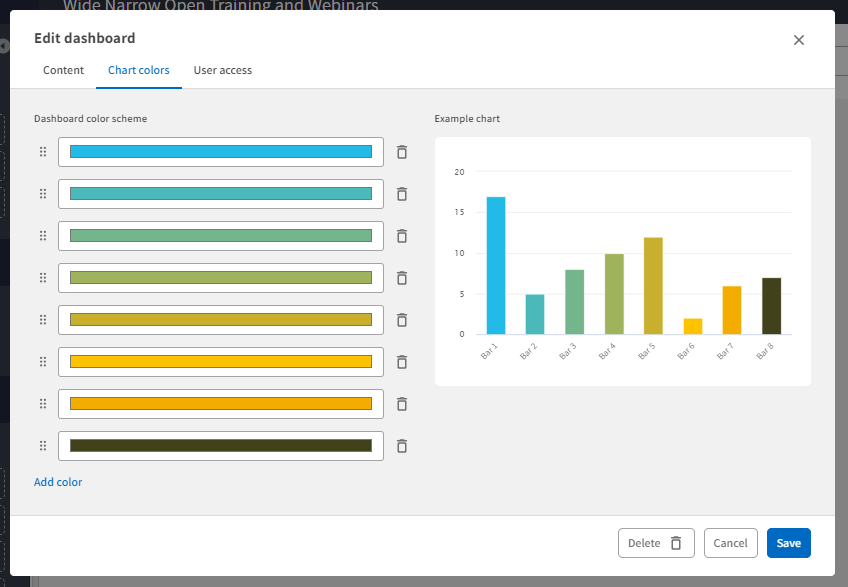
2. Select Edit and then Chart Colors.
3. Click on a color bar to change a specific color. Change the color code or move around the pointer to select a new color.
4. Click Add color to add new colors.
5. Click the bin to remove one color.
6. Use the handles to the left of the color bar to change the color order.
7. Press Save when you have updated the color scheme.
User Access: Only Dashboard Owners can change the color settings of the Dashboard.
Comments
0 comments
Please sign in to leave a comment.