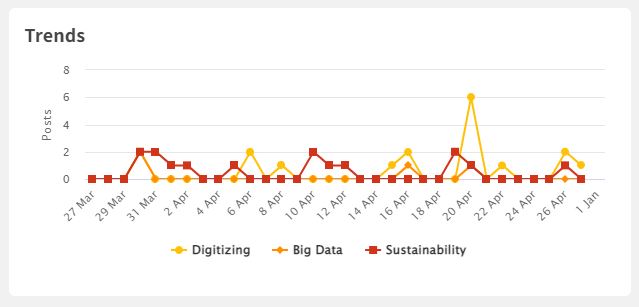
The Time Series Chart widget enables visualization of trends and other topics over time. The widget allows you to display a chart of a selected type (column or line) based on data from either a selected saved search or the Dashboard post list widget.
Prerequisites: The Dashboard must contain a Post list Widget for the Time Series widget to display posts.
Add the widget
To create a shared Dashboard Widget that can be used on several dashboards:
- Navigate to the Dashboard overview page, click Widgets in the top menu, and then the New Widget button.
- Select Chart in the top menu and then click Add on the Time Series card.
To create a widget only available for a specific Dashboard:
- Navigate to the Dashboard overview page and click the settings icon on a Dashboard card and select Manage widgets.
- Click the blue Add/New Widget button at the top right of the Dashboard page and select an area to position your widget (top, right, or left).
- Select Chart in the top menu and then click Add on the Time Series card.
Configuring the widget
In the New Time Series Widget admin form:
- Name: Type the name of the widget. The name will be the title of the widget on the Dashboard. Choose a name that clearly explains the widget.
- Type: Select if you want to display the data in a line or column Time Series chart.
- Data source:
- Select Dashboard to base the Time Series chart on posts from the Dashboard post list. Widgets based on dashboard post lists are connected and change simultaneously.
- Select Saved Search if you want to base the Time Series chart on posts from a Saved Search. Widgets based on saved searches are independent of each other and do not change simultaneously. Select a System Saved Search from the drop-down list. Note that the saved search must be a "System Saved Search." Personal and Shared Saved Searches are not selectable.
- Time Period: Select the Time period you wish to reflect in the chart: the number of days, months, or years.
- Categories:
- Select the number of posts per day if you want the Times Series chart to be based on the total number of posts per day from a Dashboard post list or Saved Search.
- Select Custom categories if you want to base the Times Series chart on specific taxonomy categories or fields. Search and select categories or tick the fields or particular categories you wish to add. Remove categories by clicking the cross behind the chosen category above the taxonomy. Click Save. If no taxonomy categories or fields are selected, the chart will show the total number of posts per day.
- Press Save. The widget is now available to review on the Dashboard.

User Access: Dashboard Widget Administration is only available for Admins and Superusers with Owner access to a Dashboard. Only Admins can create System saved searches.
Comments
0 comments
Please sign in to leave a comment.