The Chart widgets allow you to display a chart of a selected type (pie, column, or line chart) based on data from either a selected Saved Search or the Dashboard Post list in combination with manually selected taxonomy categories.
Prerequisites: The Dashboard must contain a Post list Widget for the chart widget to display posts.
Chart colors: The data points' colors in the chart derive automatically from the Dashboard "Chart colors" setting. You cannot control the colors for a specific column/line/pie chart. Go to Dashboard >Settings > Edit > Chart Colors to change the chart colors.

Add the widget
To create a shared Dashboard Widget that can be used on several dashboards:
- Navigate to the Dashboard overview page, click Widgets in the top menu, and then the New Widget button.
- Select Chart in the top menu and then click Add on a Column, Line, or Pie chart card.
To create a widget only available for a specific Dashboard:
- Navigate to the Dashboard overview page and click the settings icon on a Dashboard card and select Manage widgets.
- Click the blue Add/New Widget button at the top right of the Dashboard page and select an area to position your widget (top, right, or left).
- Select Chart in the top menu and then click Add on a Column, Line, or Pie chart card.
Configuring the widget
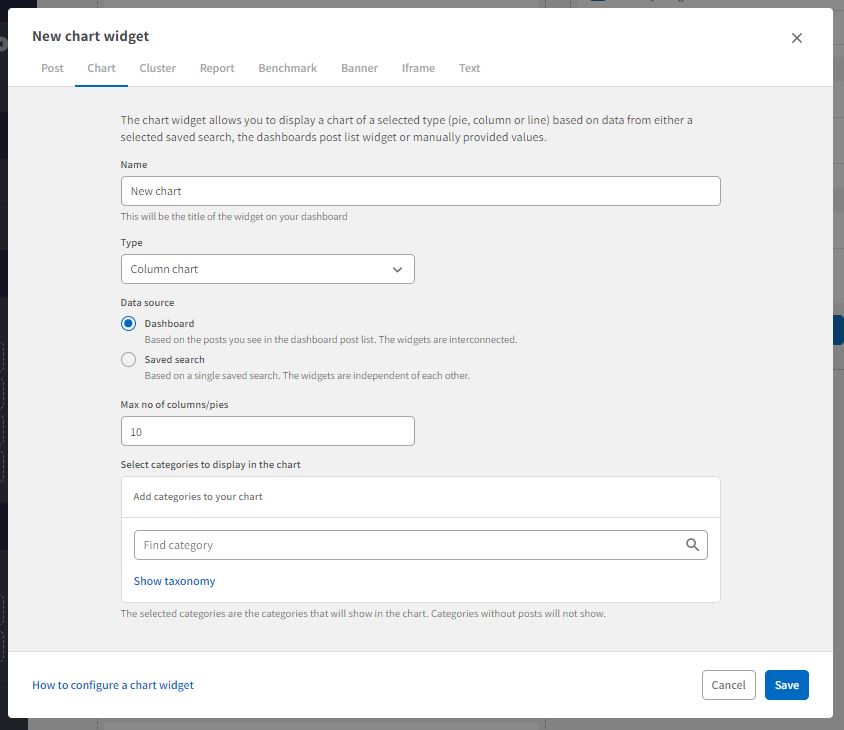
In the New Chart Widget form:
Name: The name you type will be the title of the widget on the Dashboard. Choose a name that clearly explains what the widget is showing.
Type: If you want to change the type of chart to display on the widget, select another chart from the drop-down list.
Data source: A chart is nothing without data to display:
Data source DASHBOARD:
- Select Dashboard to fetch data from the dashboard post list in the widget. All dashboard widgets will be interconnected.
- Max no of columns/pies: Set a maximum number of columns, lines, or pieces of the pie chart you wish to display in the chart. We do not recommend more than eight columns, lines, or pieces per chart.
- Select categories to display in the chart: Use the search field or click Show taxonomy to select categories or fields to display in the chart. No data will be displayed if a chosen category has no posts tagged with that category in the set period.
- Click Save to save the new widget.
Data source SAVED SEARCH:
- Select Saved Search to fetch data that match the saved search you select, providing a dynamic chart that changes along with the information. To function optimally, the saved search should have several posts that match its filter. The widgets are independent of each other.
- System saved Searches: Select a saved search from the drop-down list. Note that the saved search must be a "system saved search." Private and Shared Saved Searches are not selectable.
- Time period: Select the time you wish to reflect in the chart: the number of days, months, or years.
- Max no of columns/pies: Set a maximum number of columns, lines, or pieces of the pie chart you wish to display in the chart. We do not recommend more than eight columns, lines, or pieces per chart.
- Select categories to display in the chart: Use the search field or click Show taxonomy to select categories to display in the chart. No data will be displayed if a chosen category has no posts tagged with that category in the set period.
- Click Save to save the new widget.

User Access: Only superusers with Admin privileges can create brand new Dashboards. Admins may, however, grant other superusers the authority to modify and update existing Dashboards. Superusers who are permitted to change Dashboards can also add new Dashboard Widgets.
Comments
0 comments
Please sign in to leave a comment.