Use the Manual Chart Builder if you wish to build a chart with manually entered fixed data. Note that this widget needs to be updated manually. The widget cannot interact with other Dashboard widgets.
Add the widget
To create a shared Dashboard Widget that can be used on several dashboards:
- Navigate to the Dashboard overview page, click Widgets in the top menu, and then the New Widget button.
- Select Chart in the top menu and then click Add on the Manual Chart Builder card.
To create a widget only available for a specific Dashboard:
- Navigate to the Dashboard overview page and click the settings icon on a Dashboard card and select Manage widgets.
- Click the blue Add/New Widget button at the top right of the Dashboard page and select an area to position your widget (top, right, or left).
- Select Chart in the top menu and then click Add on the Manual Chart Builder card.
Configuring the widget
In the Manual Chart Builder Widget admin form:
- Name: Type the name of the widget. The name will be the title of the widget on the Dashboard. Choose a name that clearly explains the widget.
- Type: Select if you want to display the data in a line, column, or pie chart.
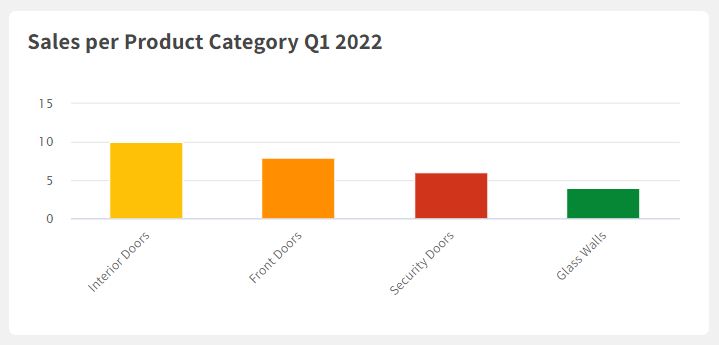
- Data Points: Add the name of the data points you want to display in the chart, for example, product categories, business areas, or sales regions. Enter a number connected to each data point. Click Add data point to add more data points.
- Chart unit: Add a chart unit for the numbers displayed, for example, currency.
- Press Save. The widget is now available to review on the Dashboard.
Chart colors: The line or column colors in the chart derive automatically from the Dashboard "Chart colors" setting. You cannot control the colors for a specific chart. Go to Dashboard >Settings > Edit > Chart Colors to change the chart colors.

User Access: Dashboard Widget Administration is only available for Admins and Superusers with Owner access to a Dashboard.
Comments
0 comments
Please sign in to leave a comment.